Why average office occupancy can mislead refreshment operators
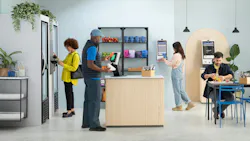
At one 120-person San Francisco office served by Office Libations, Tuesday through Thursday are core days. On Mondays and Fridays, only about 10 people may come in. CEO Claude Burns estimates consumption at an individual account can swing as much as 90% from peak to trough.
Then there are the days that do not follow the pattern. “When a 200-person office suddenly eats like a 400-person office, things run out,” Burns said of unannounced all-hands events. And Burns should know: San Leandro, Calif.-based Office Libations serves clients with workplace pantry programs across 25 U.S. markets.
Operators can plan for a recurring pattern. The harder task is keeping pace when the pattern changes or when the client does not share the change.
Office occupancy data trends
Kastle Systems’ late-July access-control data helps explain why. The company reported that Class A+ buildings nationally averaged 78.4% of their pre-COVID access-activity baseline for the week, while Tuesday activity reached 95.2%. Across all building classes in Kastle’s 10-city barometer, the weekly average was 56.5%, compared with 66.5% on Tuesday.
Those percentages do not mean the buildings were 95.2% full. Kastle counts each cardholder’s first daily entry and compares current activity with a three-week baseline from February 2020. Its barometer covers participating buildings in 10 major metropolitan areas, not a nationally representative statistical sample.
For operators, a weekly average can hide the day that actually determines how much food, coffee and pantry inventory an account needs. A badge swipe shows that someone entered a building. It does not show how long the person stayed or how much that person consumed.
Midweek concentration is common, but not universal
Jon Holden, vice president of sales and marketing at All Star Services, Port Huron, Mich., sees a familiar pattern among its customers with hybrid workforces.
“Monday is slow, Tuesday through Thursday are great with higher sales and consumption, and Friday is a ghost town with just a handful of folks coming into the office,” Holden said.
Blake Jones, vice president of sales and marketing at Pot O’ Gold Coffee Service, sees a similar Tuesday-through-Thursday concentration in the Seattle market. The pattern has been consistent for several years, he said, but more employees have been coming in during that midweek window over the past year.
But that pattern is not universal. Ashilyn Sunderman, CEO of Smith Vending Canteen, Clarinda, Iowa, said consumption at her company’s accounts is generally consistent Monday through Thursday. At accounts that slow down on Friday, sales average about 60% of the usual level. During holidays, that can fall to 25%.
William Mandile, director of customer experience at Marché, said the Monday-and-Friday ghost-town pattern began changing by midsummer at the large metropolitan accounts his company serves. Many were producing meaningful demand on four of the five weekdays, with lighter demand on Fridays. Mandile noted that Marché manages roughly 150 employer-funded workplace pantries and serves large metropolitan markets across the U.S. Because employees do not pay at the point of use, the company plans around headcount, consumption and client budgets rather than item-level sales.
Five Star Breaktime Solutions, a Southeast regional operator providing vending, micro markets, office coffee service and pantry, sees another curve across its broader portfolio. C. J. Recher, vice president of marketing, said total daily transactions across all Five Star location types generally build from Monday to a Thursday peak, then drop 8% to 10% Friday. Five Star’s figure covers all location types, not just offices, which helps explain the smaller Friday drop.
Taken together, the responses show why operators cannot build every hybrid account around a presumed Tuesday-through-Thursday schedule. Even where office attendance peaks sharply midweek, the size of the Friday decline and the strength of Monday demand vary.
Transaction data provide a clearer demand signal
Operators have access to different information depending on whether they are managing vending, micro markets or pantry service. Transaction data give vending and micro market operators a direct record of what was purchased and when. Pantry operators must estimate consumption without an individual transaction every time an employee takes a product.
Vending and micro market operators can look to sales data. Sunderman of Smith Vending Canteen said she relies on transaction history. All Star also plans inventory and service around actual transaction history. Holden said those records can produce an accurate forecast after a few weeks.
All Star also has changed how much it stocks and when it makes deliveries in response to hybrid attendance, Holden said. Company growth has allowed All Star to add hybrid accounts without adding staff.
Five Star combines historical and current information. “It’s a layered approach,” said Dylan Sogor, vice president of operational excellence. The company compares actual transaction history with the same period a year earlier, then adjusts for seasonality, return-to-office trends and other changing patterns.
Fresh food raises the stakes because of its limited shelf life, Sogor said.
Office Libations uses statistical models and proprietary data to predict consumption levels, and relies on customer success employees to interpret the results and fine-tune each account. Burns said that process is continuous rather than quarterly.
The company’s delivery schedule does not necessarily mirror its clients’ attendance patterns, Burns added. Although Monday and Wednesday are its busiest delivery days, other delivery days remain within about 20% of those peaks. Office Libations has balanced its own workload even as consumption at individual accounts fluctuates.
OCS provider Pot O’ Gold most often starts with weekly headcount. Jones said he typically recognizes a change when the amount normally stocked no longer matches the previous month’s consumption, prompting the company to call the client.
Marché adds people to the feedback loop at many of its larger accounts. Mandile said on-site attendants place orders and manage programs within a per-person budget. The company aims to carry enough backstock to reach the next service without tying up the client’s budget in excess or expired inventory.
The approaches differ, but the objective is the same: stock enough to serve the busiest period without allowing a slower day to create excess inventory or fresh-food waste.
The client information gap
“We honestly don’t get notified most of the time when there are changes to headcount or average daily headcount,” Jones said. Advance notice, especially of changes in average daily attendance, would improve inventory and service planning, he added.
Most Office Libations clients share their core days and overall headcount, Burns said, but exact attendance by weekday is rarely available. Five Star also finds client-provided attendance information sparse. Sogor said averaged badge-swipe data by weekday would be particularly useful.
All Star’s experience shows why the detail matters. A policy requiring three full working days provides something an operator can plan around, Holden said. A client who simply says most employees are present Tuesday and Wednesday may have only a small portion of the workforce staying for the full day.
Smith Vending Canteen takes a more targeted approach to known disruptions. Sunderman said the company contacts larger clients about holiday staffing. Clients generally provide notice of closures or reduced staffing. An unexplained sales decline triggers a call from the operator.
There is no single hybrid-work pattern for operators to follow. As Burns put it, technology produces the insights while people execute and adjust. “It’s not all tech; it’s not all vibes. We leverage the strengths of both.”
About the Author
 Linda Becker
Linda Becker
Head of Content
Linda Becker is head of content for Automatic Merchandiser and VendingMarketWatch.com, responsible for the brands’ overall content strategy, planning and performance. She oversees the creation and performance of editorial and multimedia content across platforms such as magazines, websites, webinars, podcasts, newsletters, videos, social media, events and eBooks.
Since joining Automatic Merchandiser and VendingMarketWatch.com, Linda has developed a new appreciation for the convenience services industry and its essential role. She is dedicated to serving readers by covering the latest news in the vending, office coffee service and micro market industry. She can be reached at 262-203-9924 or [email protected].