Hershey Announces Second-Quarter Results; Updates Outlook For 2016
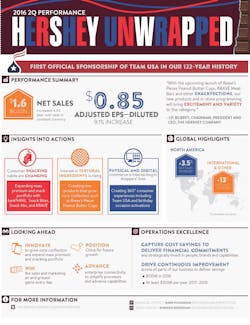
HERSHEY, Pa.--(BUSINESS WIRE)-- The Hershey Company announced sales and earnings for the second quarter ended July 3, 2016. Consolidated net sales were $1,637.7 million compared with $1,578.8 million for the second quarter of 2015. Reported net income for the second quarter of 2016 was $146.0 million or $0.68 per share-diluted, compared with a net loss of $99.9 million or $0.47 per share-diluted for the comparable period of 2015.
- Second-quarter net sales increased 3.7%, including the impact of acquisitions and foreign currency exchange rates:
- Acquisitions a 0.5 point benefit
- Unfavorable foreign currency exchange rates a 0.8 point headwind
- Second-quarter earnings per share-diluted of $0.68 as reported and $0.85 adjusted
- Outlook for 2016 net sales updated, adjusted earnings per share-diluted reaffirmed:
- Full-year net sales expected to increase around 1%, including a net benefit from acquisitions and divestitures of about 0.5 points and unfavorable foreign currency exchange rates of about 1.0 point
- Reported earnings per share-diluted expected to be in the $3.77 to $3.86 range
- Adjusted earnings per share-diluted expected to increase 3% to 4%, including dilution from acquisitions of $0.05 to $0.06 per share, and be in the $4.24 to $4.28 range
- Quarterly dividend declared on Common Stock and increased 6%
Second-Quarter Performance
Consolidated net sales were $1,637.7 million in the second quarter of 2016, an increase of 3.7% versus the second quarter of 2015. Excluding the effect of foreign currency translation, a 0.8 point headwind, net sales increased 4.5% versus the year ago period. Volume was a 3.1 point contribution to sales growth and slightly greater than forecast due to the timing of shipments in North America. As expected, net price realization was 0.9 points favorable as direct trade and returns, discounts and allowances in the International and Other segment were less than last year. Acquisitions were a 0.5 point benefit in the second quarter.
Adjusted gross margin was 45.5% in the second quarter of 2016, compared to 46.7% in the second quarter of 2015. The 120 basis point decline was driven by higher commodity and other supply chain costs and unfavorable sales mix, partially offset by supply chain productivity and costs savings initiatives.
Total advertising and related consumer marketing expense increased about 5% versus the second quarter of 2015. For the full year, the combined investments of advertising and related consumer marketing expense, as well as direct trade in North America, are expected to increase, supporting new product launches and in-store merchandising and display activity. Selling, marketing and administrative (SM&A) expenses, excluding advertising and related consumer marketing and the barkTHINS acquisition, declined about 2.6% in the quarter, driven by the previously mentioned increase in our annual productivity and cost savings target as well as the initiative announced in June of 2015. As a result, consolidated adjusted operating profit of $295.6 million in the second quarter of 2016 increased 2.1% versus the second quarter of 2015.
As expected, the second-quarter adjusted tax rate of 31.4% was lower than the prior year period of 35.3%, largely as a result of investment tax credits. However, due to timing differences, the corresponding book expense for a portion of the credit investments will not be recognized until the second half of the year. In the first half of 2016, the company repurchased $420 million of outstanding shares, resulting in diluted shares outstanding of 214.5 million at the end of the second quarter of 2016, compared to 219.6 million for the same period of 2015.
North America (U.S. and Canada)
Hershey’s North America net sales were $1,444.8 million in the second quarter of 2016, an increase of 3.2% versus the same period last year. Excluding the 0.3 point impact of unfavorable foreign exchange rates in Canada, North America net sales increased 3.5%. Volume was a 4.5 point contribution to sales growth, slightly greater than forecast due to timing of shipments. Net price realization was off 1.6 points, as anticipated, due to higher levels of direct trade supporting in-store merchandising and display and related promotional price points. The barkTHINS acquisition was a 0.6 point benefit in the second quarter of 2016.
Total Hershey U.S. retail takeaway1 for the 12 weeks ended July 9, 2016, in the expanded all outlet combined plus convenience store channels (xAOC+C-store) increased 0.5%, with market share off 0.1 points. For the 12 weeks ended July 9, 2016, Hershey’s U.S. CMG market share was 30.8%, a decline of 0.7 points versus the same period last year.
North America segment income declined 7.6% to $425.7 million in the second quarter of 2016, compared to $460.7 million in the second quarter of 2015. The decline in segment income was driven by lower gross margin due to higher levels of direct trade, unfavorable sales mix, increased commodity costs and a 10.6% increase in advertising and related consumer marketing expense. Full report.
1Includes candy, mint, gum, salty snacks, snack bars, meat snacks and grocery items
